This report provides a brief analysis of the Electric Blankets sub-market in the Amazon US market, hoping to provide valuable information for cross-border industry stakeholders of Amazon from market trends, product analysis and recommendations, consumer insights, and other aspects.
Contents
- I Introduction
- II Marketing Analysis
- III Product Research
- IV Competitive Analysis
- V Feasibility suggestion
I. Introduction
In the Amazon US market, electric blankets are a type of blanket used to cover beds or bodies, providing full-body heating and suitable for use in winter or cold environments. Electric blankets typically consist of a soft blanket and built-in heating elements. When powered on, the heating elements will heat the surface of the blanket, and users can adjust the heating temperature through a controller.
With the increase in consumer reliance and the impact of last year's energy crisis, electric blankets have seen a new round of demand gaps, with higher requirements for design, size, functionality, and scenarios.
According to this report, the Electric Blankets market has shown significant growth, with great opportunities for new product entry and easy supply chain connections. However, there are also challenges such as seasonal fluctuations, strict certification requirements, and high demands for quality and safety. The market presents both risks and opportunities, so potential sellers should carefully consider their options and choose wisely.
| Strengths | Weaknesses |
| 41% of the TOP100 products are new, indicating a relatively high proportion of new products. New products have a higher chance of entering the market, and both year-on-year and month-on-month data show an upward trend, indicating significant market growth. There is ample room for adjusting product pricing. Chinese domestic sellers have a high market share, making it easier to find suitable supply chains. | A+ accounts for 90%, videos account for over 40%, and high design requirements. Although most of the top brands are new, the brand layout is mostly vertical and the competition is fierce. For large products, the shipping time is long, and waterproof measures should be taken for electrification. The key phrase has a relatively high PPC, and the early marketing promotion costs are high. |
| Opportunities | Threats |
| The translation of the provided content into English Product upgrades and iterations are diverse, allowing for transformations in terms of style, performance, scenarios, and methods. The top usage environment for the product is as a gift, and in the second half of the year, it is influenced by both the colder weather and the increase in holidays, resulting in a sustained demand. Electric blankets for heating may become a substitute for downgraded winter consumption. | Electrical products require UL or ETL and FCC certifications. Consumers have extremely high requirements for product safety and quality, guarding against the risks of fire and burns. Seasonality is severe, efficient coordination is needed for stocking, operations, and promotions. |
II. Marketing Analysis
The basic market situation
In the TOP100, the average monthly sales volume is 1,581 units, which is a 51% increase compared to the average monthly sales volume of 1,044 units in the same period last year. New products account for 41% of the total, and sales account for 38.7%. To some extent, it is relatively easy for new products to enter the TOP100 list in this market. The concentration of goods, brands, and sellers is not high, and there is no market monopoly effect.
The average price of new products is $50.82, which is the same as the average price of TOP100. There is no significant price competition between new and old products. However, the average monthly price of new products has decreased by $10 compared to the same period last year, reaching a gradually balanced state of supply and demand in the market.
| All Listing(in 6 months) | |
| Total items | 742 |
| Return rate | 10.7% |
| Search for purchasing ratio | 2.8‰ |
| Top 10 Listing | |
| Monthly sale | 4,889 |
| Monopoly level | 3 |
| Average monthly revenue | $191,032 |
| New Listing (Launched within 6 months in TOP100) | |
| Number/Proportion of New Products | 41 (41%) |
| Average monthly sale | 1493 |
| Sales proportion | 38.7% |
| Average monthly revenue | $70,020 |
| Average price | $50.82 |
| Listing Sample(TOP100) | |
| Basic Information | Products:100 Brands:46 Sellers:44 |
| Sellers | FBA: 78% AMZ: 11% FBM: 11% |
| Monthly Sale | 158,141 |
| Average monthly sale | 1,581 |
| Monthly Revenue | $72,311 |
| Average Price | $49.77 |
| Average Reviews | 2,353 |
| Average Ratings | 4.4 |
| Average gross profit margin | 66% |
| Listing Sample(TOP100) | |
| Average Seller Number | 1.2 |
| A+ proportion | 93% |
| Product concentration | 31% |
| Brands concentration | 58% |
| Seller concentration | 56% |
| Seller's location | China:78% ; USA:15% |
Category keywords Google Trends
Keywords include:
- heated blanket
- electric blanket
- heated throw
- electric throw
- heating blanket
Based on the trends of the past five years, all the key terms show clear seasonal popularity and have been consistently increasing year by year. In the winter of 2022, there was a significant surge, possibly related to an energy crisis.

From a one-year perspective, there is a clear cyclical variation in keywords. The trend starts to rise in October and reaches its peak in mid-December. The lowest point usually occurs during the summer months (May, June, July).

Category Keyword ABA Ranking Trend
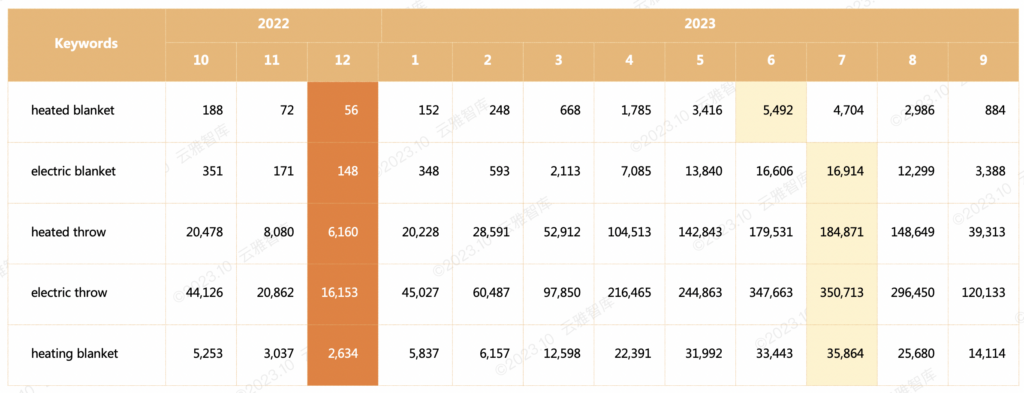
The core keywords "heated blanket" and "electric blanket" have consistently maintained high rankings in ABA, even during the off-season, staying within the top 20,000. This indicates a significant consumer demand for this category of products.
Based on the ABA ranking trends, it can be observed that the peak season for electric blankets is generally from October to January of the following year.
BSR sales and competitive situation
In terms of monthly sales, electric blankets start to rise in July each year and reach their peak sales in December. The sales performance is consistent with the trend of keyword searches and shows obvious seasonality.
In the past 5 years, except for 2021, the annual sales have grown at a rate of over 70% each year. It is expected that the annual sales in 2023 will reach 4 million units.
The number of category products in 2021 showed relatively stable performance. In 2022, the product count increased from 600 to 1000+. Although there was an influx of new sellers, the overall base was not significant.


Summary

Based on the above, the preliminary estimate for the electric blanket market on Amazon US in 2022 is $150 million. It is projected that this market will grow at an annual rate of 60%. By the end of 2023, the annual sales volume is expected to increase to 4 million units, with annual revenue reaching $210 million. The market prospects are very promising.
Although the market is growing rapidly, new products account for a significant 41% share in the electric blanket sub-market. This means that there is a great opportunity for new products to enter the top 100. Additionally, according to the disclosure from the US Consumer Product Safety Commission (CPSC), product quality and safety issues should not be underestimated, as they could undermine all efforts.
III. Product Research
Product Operations Analysis
Based on recent sales trends, the period from October to March of the following year is the peak purchasing season for Amazon US consumers. Under the influence of last year's global energy crisis, the rising curve of electric blankets in 2022 is steeper than in previous years.
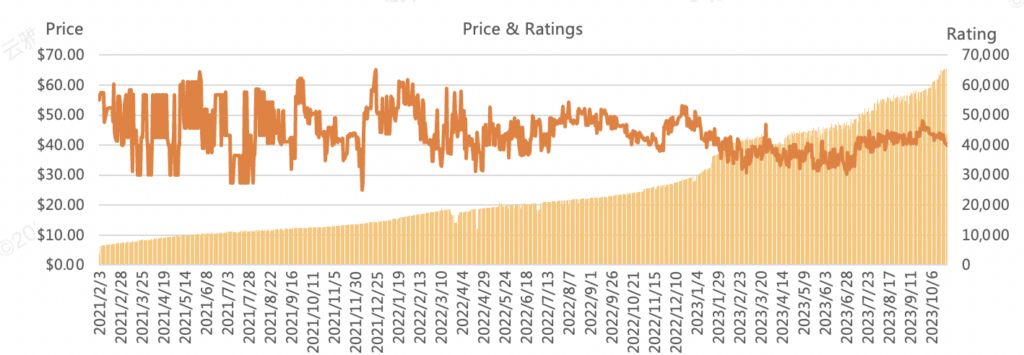
According to the data as of September 2023, there has been a varying degree of year-on-year increase. The energy crisis has driven the emergence of phenomenal best-selling products, gradually evolving into consumers' daily winter heating needs.
The product prices have shown a significant decline over time, indicating intense competition.
Price Analysis
Product price distribution: The price range of $30-$34.99 has the highest sales volume and average sales per ASIN, indicating that it may be the position where mature familiar products are located. In the $35-$39.99 range, ASINs have the highest proportion, but there is no particularly strong market dominance. Products have potential in the price range of $20-$88.
New product price distribution: New products cover various price ranges of existing products, providing a wide range of pricing options. Low-price strategies can be chosen, as well as high-priced innovative new products.
| Price | ASIN | New Asin | Monthly Sale rate | Average Sale of Single Asin |
| $20-29.99 | 20.0% | 15.5% | 18.3% | 2,430 |
| $30-34.99 | 16.7% | 6.9% | 35.2% | 5,616 |
| $35-39.99 | 35.0% | 22.4% | 33.4% | 2,536 |
| $40-49.99 | 20.0% | 8.6% | 10.6% | 1,415 |
| $50-59.99 | 5.0% | 5.2% | 1.2% | 637 |
| Above $60 | 3.3% | 1.7% | 1.3% | 1,025 |
Brands Analysis
In the performance of electric blankets brands, there are 9 brands that have multiple ASINs entering the TOP100, and 5 brands that have single ASINs entering. The sales volume of single ASINs is all above 2000 units, and the sales revenue is improving.
The top brand, Homemate, is a Chinese seller that started selling home textile products in 2021. The second-ranked brand, OCTROT, has less than 5 products in total in their store, but they achieve a monthly sales revenue of nearly $500,000. The third-ranked brand, Bedsure, is a well-known brand under Shangbai Global, based in Wuxi, China. They specialize in various types of home products such as bedding, towels, and blankets. Bedsure has previously held the top position in the Amazon cross-border home textile field.
| Brands | ASIN | Monthly Sale | Sale Rate | Monthly Revenue | Monthly Revenue Rate |
| Homemate | 5 | 25067 | 15.7% | $838,393 | 14.3% |
| OCTROT | 4 | 14787 | 9.3% | $485,075 | 8.3% |
| Bedsure | 1 | 14067 | 8.8% | $472,511 | 8.1% |
| Greenoak | 1 | 10631 | 6.7% | $414,503 | 7.1% |
| SNUGSUN | 3 | 9392 | 5.9% | $341,806 | 5.8% |
| Westinghouse | 4 | 9339 | 5.9% | $394,697 | 6.8% |
| GOTCOZY | 2 | 8155 | 5.1% | $285,087 | 4.9% |
| ESTINGO | 2 | 6498 | 4.1% | $244,915 | 4.2% |
| EHEYCIGA | 2 | 5365 | 3.4% | $241,371 | 4.1% |
| Tefici | 1 | 5034 | 3.2% | $201,310 | 3.4% |
| HOMLYNS | 1 | 4869 | 3.1% | $131,414 | 2.2% |
| Reaks | 2 | 4468 | 2.8% | $176,803 | 3.0% |
| HYLEORY | 2 | 4363 | 2.7% | $127,012 | 2.2% |
| JKMAX | 1 | 4037 | 2.5% | $161,440 | 2.8% |
Situation of TOP3 brand monopoly
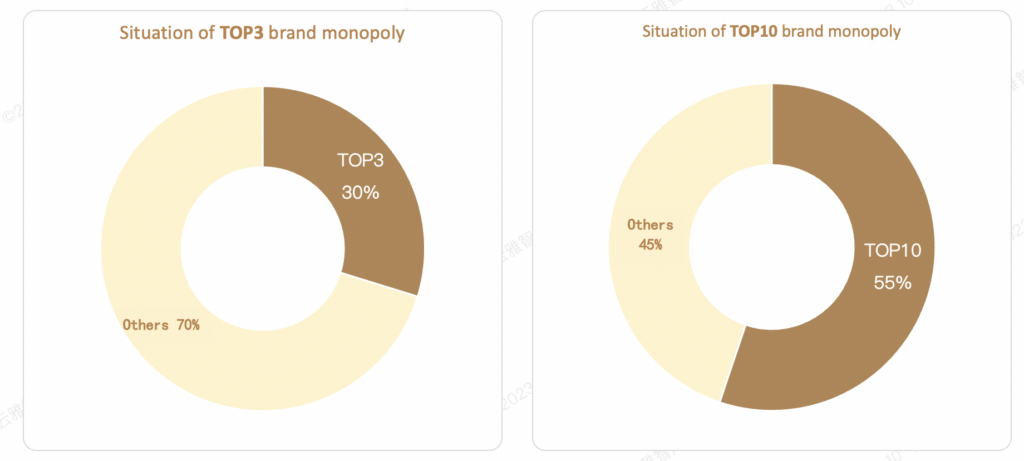
The top three brands in the category account for 30% of sales, while the top ten brands account for 55% of sales. There isn't a significant monopoly effect, and there is ample opportunity for both new and old sellers to develop and grow.
Category Brand Sales
Among the top brands in the TOP100 products, only one A product from Ninonly entered the TOP100 among the top 10 brands. The other 9 brands have multiple ASINs entering, and 6 of them have new product sales accounting for over 50%.
Looking at the proportion of monthly sales by brand, the highest proportion among the top brands is 9.43%, while the lowest is 2.43%. The overall proportion difference is small, indicating a relatively even distribution of brand market share, and most of the brands are new.
| Rank | Brands | Asins | New Asins | Monthly Sale | Brands Sale | Avg Price | Ratings | Reviews |
| 1 | Homemate | 6 | 4 | 17,422 | $662,947 | 38.31 | 4.5 | 1734 |
| 2 | Sunbeam | 7 | 3 | 13,521 | $681,504 | 62.44 | 4.2 | 17827 |
| 3 | Westinghouse | 11 | 2 | 12,459 | $654,753 | 58.24 | 4.4 | 5242 |
| 4 | SNUGSUN | 4 | 4 | 5,842 | $222,367 | 46.74 | 4.5 | 22 |
| 5 | HOMLYNS | 2 | 2 | 5,723 | $219,755 | 35.99 | 4.7 | 652 |
| 6 | SEALY | 6 | 4 | 5,705 | $525,884 | 88.66 | 4.6 | 782 |
| 7 | Ninonly | 3 | 0 | 5,548 | $264,303 | 37.99 | 4.2 | 1010 |
| 8 | greenoak | 1 | 1 | 5,232 | $168,156 | 29.99 | 4.3 | 750 |
| 9 | ESTINGO | 2 | 2 | 4,617 | $194,208 | 43.99 | 4.5 | 259 |
| 10 | Reaks | 3 | 2 | 4,337 | $175,680 | 40.3 | 4.5 | 428 |
New style inspiration
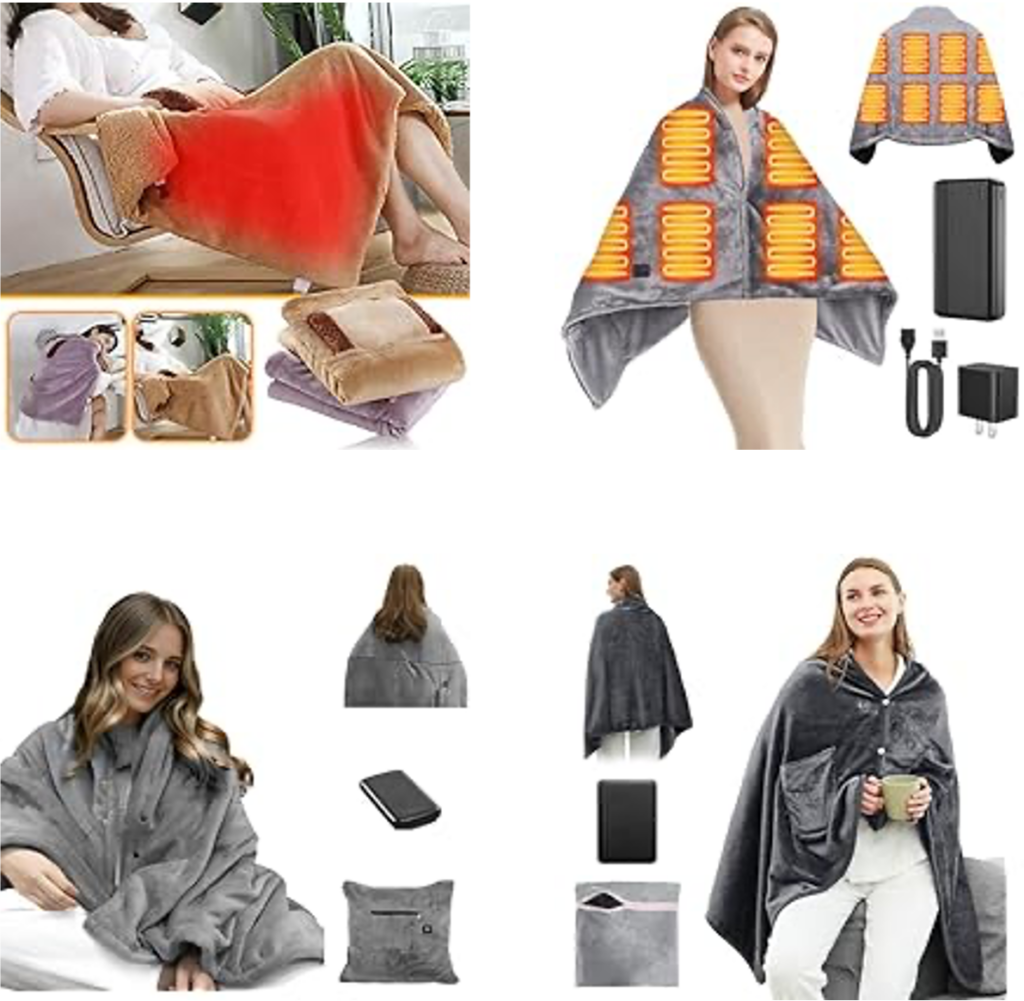
- Wearable/Shawl-style
According to the New Releases list, shawl-style and wearable electric throws are an important direction for new product releases. This style increases the warmth of the electric throw and adds designs such as buttons, which not only provide warmth but also free up the user's hands. It has become increasingly popular among consumers. - Machine Washable
Cleaning electric blankets has always been a problem due to their electrical components. In the New Releases list, machine washable electric blankets have received widespread attention and popularity among consumers. Many of these products have made "washable" a core selling point, and their sales have been relatively good, especially for those that are "machine washable." - Versatility
① Electric blankets can be folded and stored as pillows through zippers and other methods, increasing their versatility and making them useful in both winter and summer.
② Designing a pocket on the electric blanket for hand warming in winter is also an innovative and versatile feature. - Power Supply
In addition to the plug-in method, new products also offer battery, rechargeable, USB power supply, etc. For rechargeable electric blankets, some products even promote fast charging as a selling point. In addition, the use of new materials such as graphene may also be a research and development direction.
IV Competitive Analysis
Customer Profile
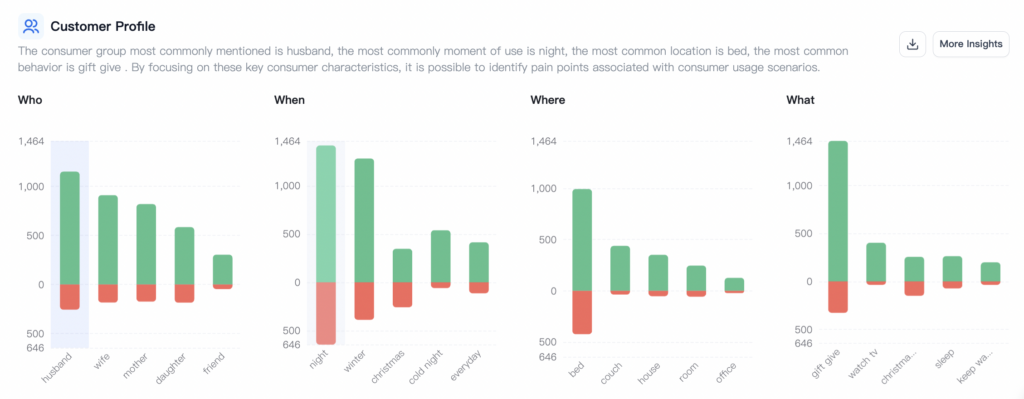
From the basic user profile, we can see that in this category, the most mentioned roles, both as buyers and users, are husbands purchasing for their wives, mothers, and children. The most common demand scenario for this category is household use.
This category has evolved from traditional usage on beds to being used in multiple rooms, living rooms, and even outdoor settings such as offices, travel, and camping. This indirectly reflects the cold winters and resource scarcity in Europe and America in recent years.
Contrary to traditional understanding, daily usage and usage in the summer also rank among the top five. Some users require warmth due to health reasons, while others start preparing for winter during the summer.
Usage Scenario
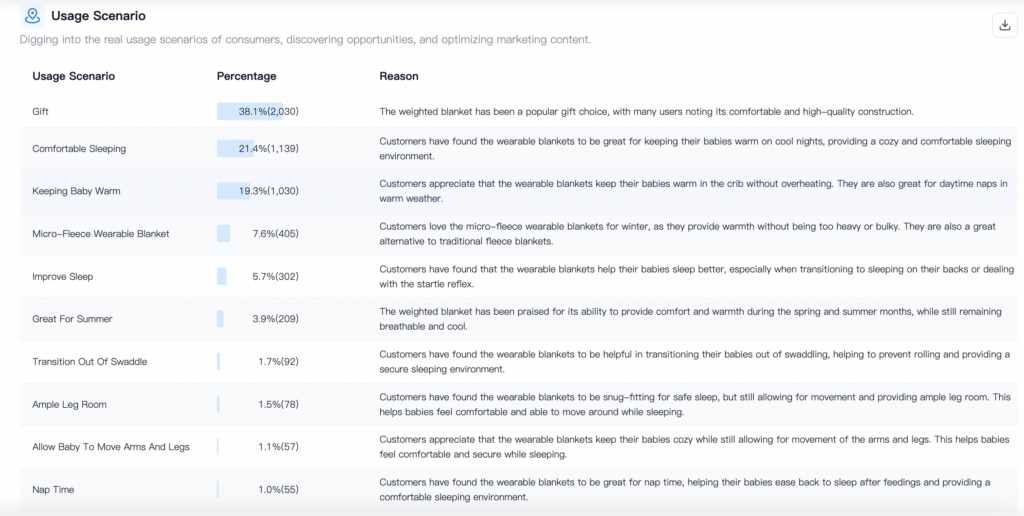
Gifts have become the number one choice in various scenarios. In recent years, the European and American regions have faced resource constraints and experienced economic downturns. During the winter season, which coincides with the biggest Christmas season, electric blankets designed for household use have become an excellent choice for gifting.
Within these top scenarios, several of them mention "babies." Unlike adults, the warmth and comfort requirements for infants and young children are higher, including the need for product comfort and flexibility in terms of space.

The core selling price range for this category is $20-60. Beyond $60, the proportion of users purchasing in various scenarios decreases significantly. On the other hand, there are hardly any users who choose prices below $20. Overall, users of this category of products tend to choose prices that are moderately higher to ensure quality assurance.
In the context of gift-giving, the preferred price range is $40-60, which is slightly higher compared to the price range for personal use scenarios.
Customers' satisfaction and dissatisfaction
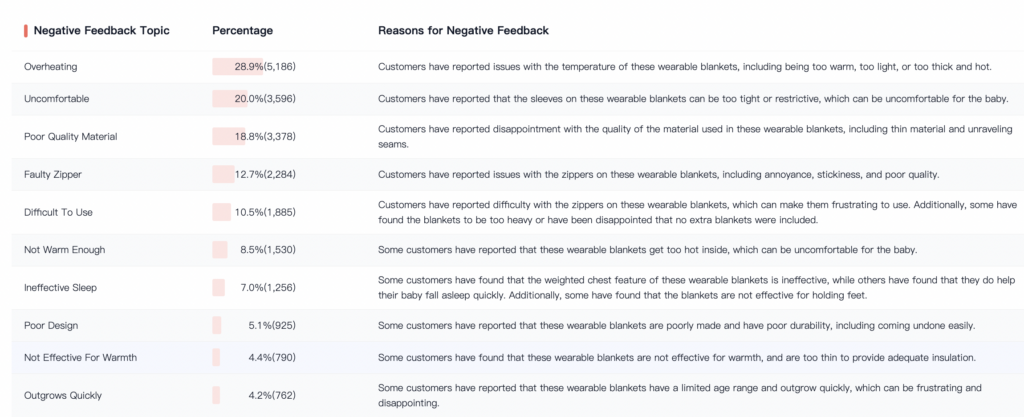
The most core requirement of users for this category is warmth, but the most serious complaint about the product is overheating, which was mentioned by nearly 30% of users. Such a high proportion of unified complaints needs to be taken seriously.
Other complaints are mainly focused on quality issues, with low tolerance for inferior materials, lack of warmth, and zipper malfunctions.
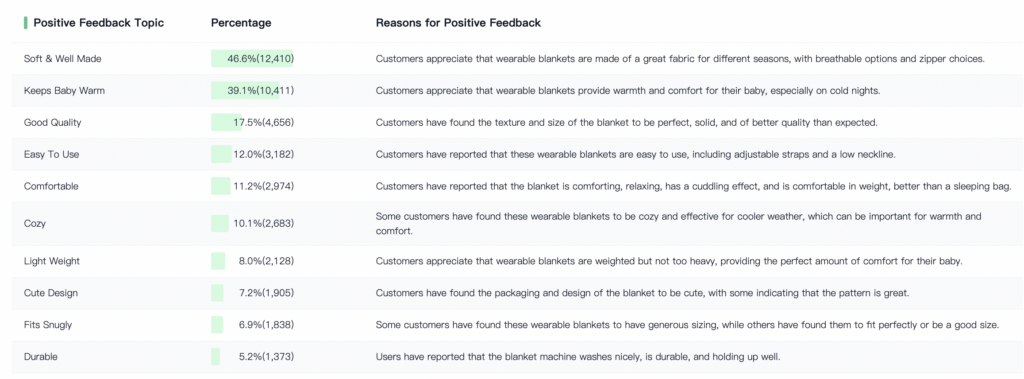
The key factors for positive reviews from users in this category are focused on softness, good quality, and meeting the needs of babies. The proportion of these key factors is very high, indicating that users have very clear and simple demands for this category of products, without excessive demands for styles or designs.
Customer Expectation
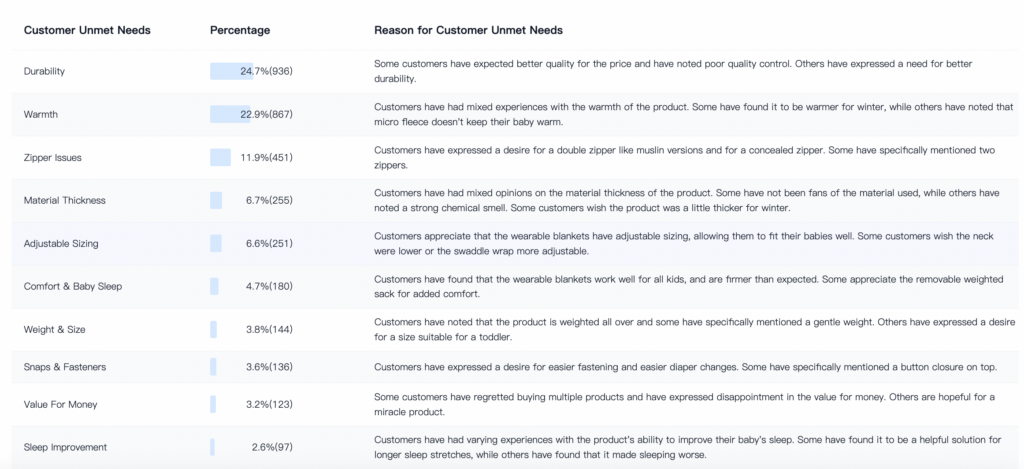
From the unmet needs of users, it can be seen that their focus is also concentrated on the two basic attributes of quality durability and heating warmth.
V. Feasibility suggestion

Product Selection Recommendations
- Strictly control product quality, focus on heating, comfort, and materials.
- Choose soft and environmentally friendly materials suitable for infants, toddlers, and pets.
- If possible, incorporate cute elements into product design, as well as gift packaging.
Marketing and Promotion Suggestions
- Focus on holiday gift marketing during the autumn and winter seasons, targeting male users with family members.
Operational Optimization Suggestions
- Introduce the atmosphere of scenes such as mother and baby, family, etc.
- Provide detailed explanations or user feedback on heating and materials, and emphasize safety.
- Include descriptions related to gift-giving scenarios, such as cost-effectiveness, timely logistics, and exquisite packaging.
Seller Sprite
SellerSprite - The Professional Amazon Keyword Optimization and Product Research Tool.

