Table of Contents
1. Introduction
2. Basic Visualization
- 2.1 Understanding Power BI Desktop
- 2.2 Exploring Power BI Service
3. Formatting Reports for Mobile View
- 3.1 Accessing Power BI Mobile App
- 3.2 Switching to Phone Layout
- 3.3 Adding Visuals to Phone View
- 3.4 Customizing Visual Placement
4. Enhancing Mobile Reports
- 4.1 Optimizing Slicer Placement
- 4.2 Including Tables and Pie Charts
- 4.3 Incorporating Tree Maps
- 4.4 Adjusting Visual Sizes
- 4.5 Adding Gauges for Impact
5. Conclusion
Introduction
In this article, we will delve into the world of Power BI and explore how to format reports for mobile view. Power BI is a powerful tool that allows users to create visually appealing and interactive reports. While we have already covered basic visualization and formatting techniques for Power BI Desktop and Power BI Service, it's essential to understand how to optimize reports for mobile devices.
Basic Visualization
Before we dive into mobile formatting, let's briefly recap the basics of visualization in Power BI. Power BI Desktop is a robust application that enables users to create and design reports with various data visualizations. On the other hand, Power BI Service allows users to publish, share, and collaborate on these reports.
Formatting Reports for Mobile View
3.1 Accessing Power BI Mobile App
To view and edit Power BI reports on mobile devices, we need to utilize the Power BI Mobile app. This app provides a seamless experience for accessing reports on the go, allowing users to stay connected to their data anytime, anywhere.
3.2 Switching to Phone Layout
Once we have the Power BI Mobile app installed, we can switch to the phone layout to format our reports specifically for mobile view. By selecting the "View" section and clicking on the "Phone Layout" option, we can enter the phone layout mode.
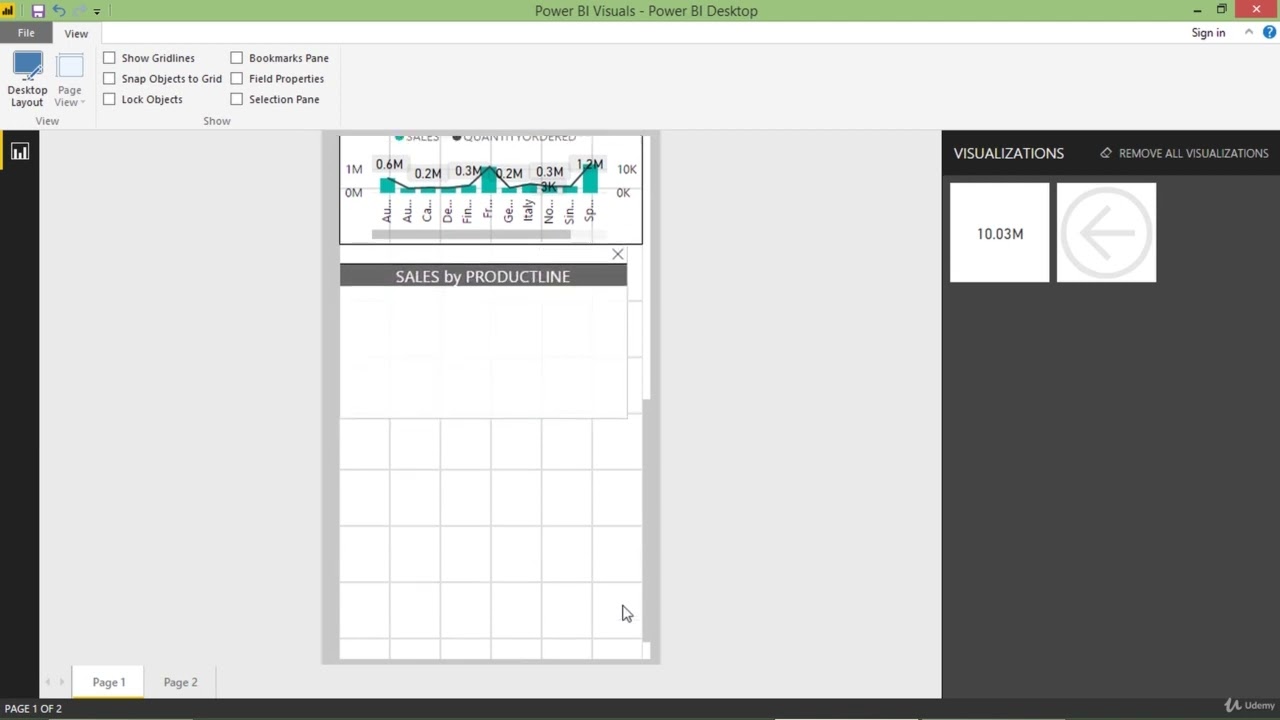
3.3 Adding Visuals to Phone View
In the phone layout mode, we can add visuals to our mobile view. By pinning the desired visuals, such as slicers, tables, pie charts, and more, we can ensure they appear in the mobile report.
3.4 Customizing Visual Placement
To optimize the mobile report's layout, we can customize the placement of visuals. We can rearrange the order of visuals, adjust their sizes, and position them strategically to enhance the overall user experience.
Enhancing Mobile Reports
Now that we have covered the basics of formatting reports for mobile view, let's explore some advanced techniques to enhance the mobile reports further.
4.1 Optimizing Slicer Placement
Slicers play a crucial role in filtering data in Power BI reports. To optimize slicer placement in the mobile view, we can position them horizontally or vertically based on our preferences and the available screen space.
4.2 Including Tables and Pie Charts
Tables and pie charts are commonly used visualizations in reports. In the mobile view, we can include these visuals to provide a comprehensive overview of the data. We can adjust their sizes and placement to ensure they fit well within the mobile screen.
4.3 Incorporating Tree Maps
Tree maps are effective visualizations for displaying hierarchical data. By incorporating tree maps in the mobile view, we can present complex data structures in an intuitive and visually appealing manner.
4.4 Adjusting Visual Sizes
To optimize the mobile report's layout, we can adjust the sizes of visuals. By resizing visuals, such as cards, gauges, and charts, we can emphasize important information and create a visually balanced report.
4.5 Adding Gauges for Impact
Gauges are powerful visualizations that provide a quick and intuitive way to represent data. By adding gauges to the mobile report, we can highlight key metrics and convey information effectively.
Conclusion
In this article, we have explored the process of formatting Power BI reports for mobile view. By utilizing the Power BI Mobile app and following the steps outlined, users can create visually appealing and user-friendly reports that are optimized for mobile devices. With the ability to customize visual placement, optimize slicer usage, and incorporate various visualizations, Power BI empowers users to deliver impactful insights on the go.
---
Highlights
- Learn how to format Power BI reports for mobile view
- Utilize the Power BI Mobile app for on-the-go access
- Customize visual placement and optimize slicer usage
- Incorporate tables, pie charts, tree maps, and gauges in mobile reports
- Create visually appealing and user-friendly reports for mobile devices
---
FAQ
**Q: Can I access Power BI reports on my mobile device?**
A: Yes, you can access Power BI reports on your mobile device by using the Power BI Mobile app. It allows you to view and interact with your reports on the go.
**Q: How can I format my Power BI reports for mobile view?**
A: To format your Power BI reports for mobile view, you can switch to the phone layout mode in Power BI Desktop. From there, you can add visuals, customize their placement, and optimize the report for mobile devices.
**Q: What are some recommended visualizations for mobile reports?**
A: Some recommended visualizations for mobile reports include slicers, tables, pie charts, tree maps, and gauges. These visuals provide a comprehensive overview of the data and are optimized for mobile viewing.
**Q: Can I adjust the sizes of visuals in the mobile report?**
A: Yes, you can adjust the sizes of visuals in the mobile report. By resizing visuals, you can emphasize important information and create a visually balanced report.
**Q: How can Power BI Mobile app benefit my workflow?**
A: The Power BI Mobile app allows you to stay connected to your data and reports on the go. It enables you to access, view, and interact with your reports anytime, anywhere, reducing the need for constant desktop access.
---
Resources:
- [Power BI Mobile App](https://www.microsoft.com/en-us/p/power-bi/9nblgggzlxn1)
- [AI Chatbot Product](https://www.voc.ai/product/ai-chatbot)

