Table of Contents
1. Introduction
2. Understanding Benchmarks
3. How Benchmarks Work
4. Using Benchmarks to Evaluate Performance
5. Saving and Comparing Benchmarks
6. Creating Cohorts for Deeper Insights
7. Leveraging Benchmarks for Goal Setting
8. Identifying Opportunities for Improvement
9. Proving Results with Benchmarks
10. Conclusion
Introduction
🔍 Understanding the performance of your online metrics is crucial for any business. You may often find yourself pondering questions like, "Is our clickthrough rate good enough?" or "Are our conversions up to par?" Fortunately, with the introduction of benchmarks in Data Box, you can now gain valuable insights and answers to these questions. In this article, we will explore the power of benchmarks and how they can help you evaluate your performance, set goals, and identify opportunities for growth.
Understanding Benchmarks
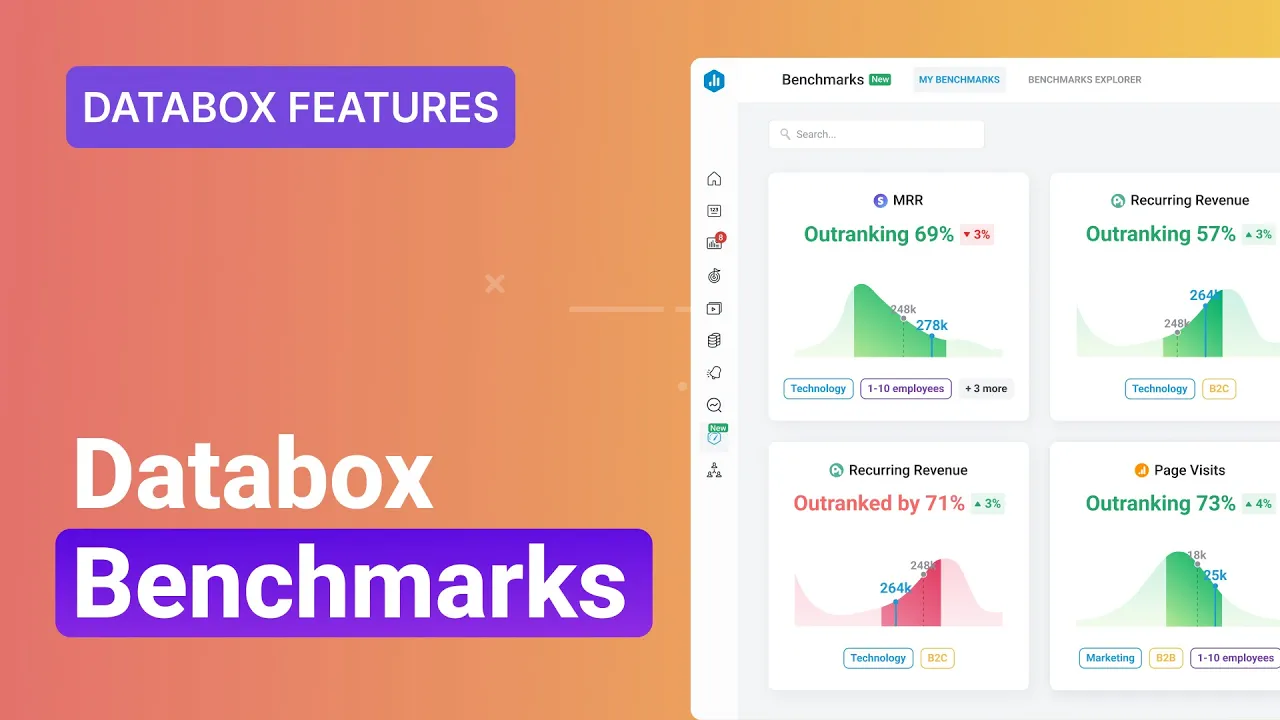
📊 Benchmarks provide a means to compare your metrics against those of similar companies in your industry. By utilizing a color-coded chart, benchmarks allow you to quickly assess whether you are ahead of the median or falling behind. Green indicates that you are outperforming the competition, while red signifies areas where improvement is needed. This visual representation makes it easy to gauge your performance at a glance.
How Benchmarks Work
🔢 To get started with benchmarks, you can save your most important metrics to your personal benchmarks page. This allows you to access them conveniently whenever you need to evaluate your performance. By comparing these saved benchmarks to the previous period, you can track how your metrics have changed over time. This historical analysis provides valuable insights into the effectiveness of your strategies and initiatives.
Using Benchmarks to Evaluate Performance
📈 Benchmarks go beyond simple comparisons. They offer insights that can help you set more realistic goals for your business. By understanding how your metrics stack up against industry standards, you can identify areas where improvement is needed and set achievable targets. This data-driven approach ensures that your goals are grounded in reality and increases the likelihood of success.
Saving and Comparing Benchmarks
💾 Saving benchmarks is a straightforward process. Once you have identified the metrics that matter most to your business, you can save them to your personal benchmarks page. This allows for easy access and comparison whenever necessary. By regularly comparing your current performance to past benchmarks, you can gain a deeper understanding of your progress and make informed decisions moving forward.
Creating Cohorts for Deeper Insights
🔍 To gain even more detailed insights, you can create cohorts by applying filters such as industry, company type, company size, and annual revenue. This allows you to compare your metrics with companies that closely resemble your own. By analyzing the performance of similar businesses, you can uncover trends, patterns, and best practices that can be applied to your own strategies.
Leveraging Benchmarks for Goal Setting
🎯 Benchmarks play a crucial role in goal setting. By utilizing the insights gained from benchmark comparisons, you can set realistic and achievable goals for your business. Whether it's improving your clickthrough rate or increasing conversions, benchmarks provide a benchmark for success. With clear goals in place, you can align your strategies and resources accordingly, maximizing your chances of achieving desired outcomes.
Identifying Opportunities for Improvement
🔍 Benchmarks not only highlight areas where you are falling behind but also reveal opportunities for improvement. By identifying metrics where you are outperforming the competition, you can analyze the strategies and tactics that led to your success. This analysis allows you to replicate and scale these successful approaches across other areas of your business, driving overall growth and performance.
Proving Results with Benchmarks
✅ Benchmarks are not just valuable for internal purposes. They also serve as a powerful tool for showcasing your results to clients, investors, managers, and board members. By leveraging benchmarks, you can provide concrete evidence of your performance and demonstrate the effectiveness of your strategies. This data-driven approach enhances your credibility and instills confidence in your stakeholders.
Conclusion
🔚 In conclusion, benchmarks in Data Box offer a wealth of insights that can help your business make better decisions, set realistic goals, and identify opportunities for growth. By comparing your metrics to industry standards and analyzing your performance over time, you can gain a competitive edge and drive meaningful results. Embrace the power of benchmarks and unlock the potential for success in your business.
Highlights
- Benchmarks in Data Box provide valuable insights into your performance compared to industry standards.
- Color-coded charts make it easy to identify areas where you are excelling or falling behind.
- Saving and comparing benchmarks allows you to track your progress over time.
- Creating cohorts based on filters helps you gain deeper insights into specific segments of your industry.
- Benchmarks are a powerful tool for setting realistic goals and identifying opportunities for improvement.
- Leveraging benchmarks allows you to prove your results to stakeholders and enhance your credibility.
FAQ
**Q: How can benchmarks help my business?**
A: Benchmarks provide valuable insights into your performance, allowing you to set realistic goals, identify areas for improvement, and prove your results to stakeholders.
**Q: Can I compare my metrics to industry standards?**
A: Yes, benchmarks allow you to compare your metrics against similar companies in your industry, providing a benchmark for success.
**Q: How can I track my progress over time?**
A: By saving and comparing benchmarks to the previous period, you can monitor how your metrics have changed and gain insights into the effectiveness of your strategies.
**Q: Can I analyze specific segments of my industry?**
A: Absolutely! By creating cohorts based on filters like industry, company type, size, and revenue, you can gain deeper insights into specific segments and uncover trends and best practices.
**Q: How can benchmarks help me prove my results?**
A: Benchmarks serve as concrete evidence of your performance, allowing you to showcase your success to clients, investors, managers, and board members.
**Q: Where can I access benchmarks in Data Box?**
A: You can access benchmarks in Data Box, a powerful tool that provides valuable insights and comparisons for your metrics.
Resources:
- [AI Chatbot](https://www.voc.ai/product/ai-chatbot)

