Table of Contents:
I. Introduction
II. The Importance of Performance Metrics
III. The Limitations of Traditional Performance Dashboards
IV. Introducing Data Box's AI-Powered Performance Summaries
V. How Data Box's Performance Summaries Work
VI. Benefits of Using Data Box's Performance Summaries
VII. Customizing Your Analysis with Data Box
VIII. Using Data Box's Generative AI Tool Tips
IX. Conclusion
X. Resources
---
🚀 Introducing Data Box's AI-Powered Performance Summaries
As a business owner or marketer, you know how important it is to track your performance metrics. However, with so many different metrics to keep track of, it can be overwhelming to analyze all of them and make sense of the data. Traditional performance dashboards can be helpful, but they often fall short in providing a comprehensive overview of your performance.
That's where Data Box's AI-powered performance summaries come in. With this innovative tool, you can easily and quickly gauge your business's performance by checking the AI-powered summary generated from your most important metrics and goals on one screen. This allows you to swiftly grasp your progress without having to analyze multiple dashboards.
📊 How Data Box's Performance Summaries Work
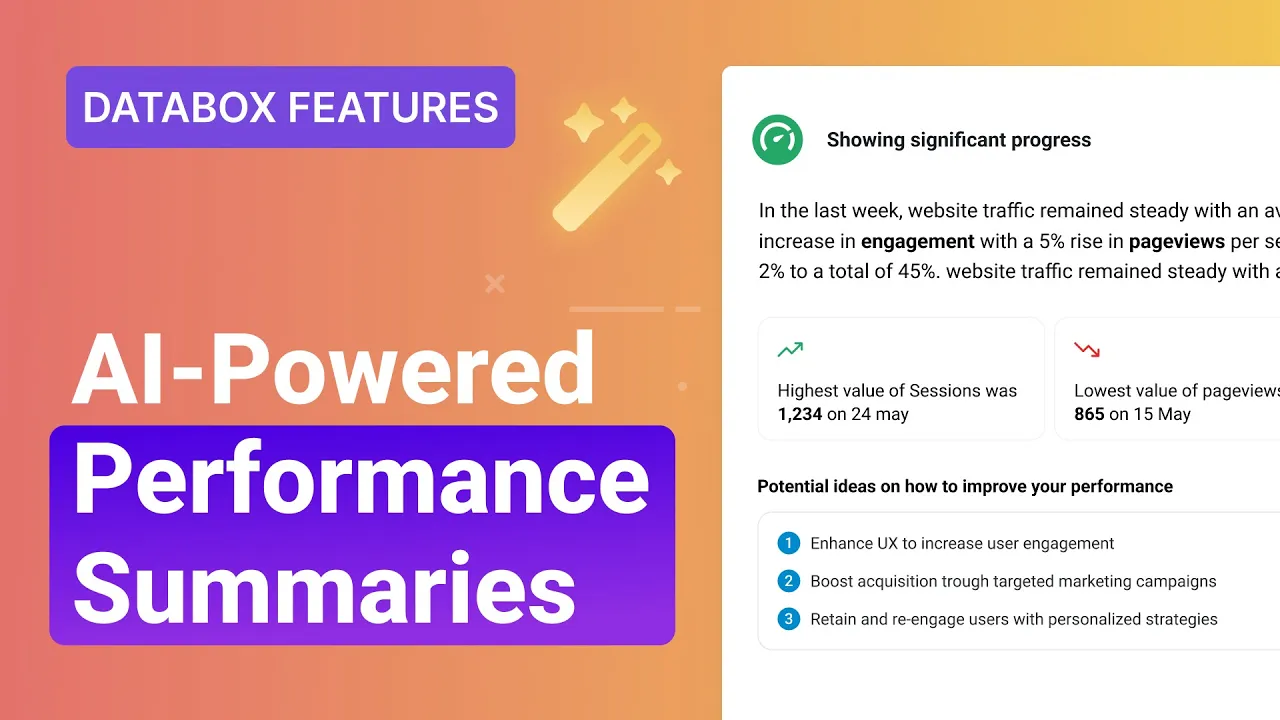
When you expand the summary, you'll quickly identify key changes, positive and negative, that impact the performance of your metrics. This will help you pinpoint where and how actions can influence outcomes. To help you optimize your approach for greater success, our AI-powered system will generate the top three recommendations to improve your performance.
💡 Benefits of Using Data Box's Performance Summaries
Using Data Box's performance summaries has several benefits. First, it saves you time by providing a comprehensive overview of your performance on one screen. Second, it helps you identify key changes in your metrics and provides recommendations for improvement. Third, it empowers you to make data-driven decisions that fuel your growth.
📈 Customizing Your Analysis with Data Box
To ensure that you have the right overview of your performance, you can adjust the analysis by selecting the time period that suits your needs. You can choose between the last 7 days or the last 30 days. This allows you to focus on the time period that is most relevant to your business.
🤖 Using Data Box's Generative AI Tool Tips
Data Box's generative AI tool tips can be found everywhere you track your performance. Just look for the performance indicators on your dashboards, metrics, and goals. The different colors will give you an instant overview of its performance. Click on it to get deeper insights with a short performance overview, color-coded progress indicator, and an intelligent suggestion for improvement.
🎉 Conclusion
Data Box has become much more than just a monitoring and reporting tool with beautiful charts and dashboards. With the introduction of AI-powered performance summaries, you can now easily and quickly gauge your business's performance and make data-driven decisions that fuel your growth. Try out Data Box's performance summaries today and set your course for success.
📚 Resources
- Data Box: https://databox.com/
- AI Chatbot: https://www.voc.ai/product/ai-chatbot
---
FAQ:
Q: What is Data Box's AI-powered performance summary?
A: Data Box's AI-powered performance summary is an innovative tool that provides a comprehensive overview of your business's performance by checking the AI-powered summary generated from your most important metrics and goals on one screen.
Q: How does Data Box's performance summary work?
A: When you expand the summary, you'll quickly identify key changes, positive and negative, that impact the performance of your metrics. This will help you pinpoint where and how actions can influence outcomes. To help you optimize your approach for greater success, our AI-powered system will generate the top three recommendations to improve your performance.
Q: What are the benefits of using Data Box's performance summary?
A: Using Data Box's performance summary has several benefits. First, it saves you time by providing a comprehensive overview of your performance on one screen. Second, it helps you identify key changes in your metrics and provides recommendations for improvement. Third, it empowers you to make data-driven decisions that fuel your growth.
Q: How can I customize my analysis with Data Box?
A: To ensure that you have the right overview of your performance, you can adjust the analysis by selecting the time period that suits your needs. You can choose between the last 7 days or the last 30 days. This allows you to focus on the time period that is most relevant to your business.
Q: Where can I find Data Box's generative AI tool tips?
A: Data Box's generative AI tool tips can be found everywhere you track your performance. Just look for the performance indicators on your dashboards, metrics, and goals. The different colors will give you an instant overview of its performance. Click on it to get deeper insights with a short performance overview, color-coded progress indicator, and an intelligent suggestion for improvement.

